لنبدأ بحجم السوق. لا تخصص السلطات الجمركية رمزًا مخصصًا لأدوات المطبخ المصنوعة من السيليكون، لذلك تستخدم هذه المقالة بيانات الاستيراد والتصدير للرمز الجمركي HS 3924.10، والذي يغطي أدوات المائدة وأدوات المطبخ البلاستيكية. في البيانات المتاحة للجمهور لعام 2023، احتلت الولايات المتحدة المرتبة الأولى. شكلت ألمانيا وفرنسا وكندا والمملكة المتحدة واليابان فئة ثانية تستحق التطوير على المدى الطويل. من الأفضل التعامل مع المملكة العربية السعودية والإمارات العربية المتحدة وأجزاء من أمريكا اللاتينية كأسواق فرص تستحق المراقبة. عندما تخطط المصانع لتطوير السوق والتواصل مع المشترين، فإنها تحتاج إلى مقارنة ليس فقط حجم الشراء ولكن أيضًا ما يسأل عنه المشترون أولاً: الامتثال، اللون، التعبئة والتغليف، أو السعر.
تشمل هذه الأرقام أيضًا أدوات مائدة وأدوات مطبخ بلاستيكية أخرى. وهي مفيدة لتقدير حجم السوق الإجمالي والتدفقات التجارية، لكنها ليست أرقام مبيعات دقيقة لأدوات المطبخ المصنوعة من السيليكون بحد ذاتها. يجب أيضًا الحكم على تفضيلات التخصيص من بيانات معاملات المنصات، ونشاط منتجات التجزئة، ومتطلبات الامتثال المحلية.
نظرة عامة على سوق التصدير: واردات الولايات المتحدة تتجاوز بكثير الأسواق الأخرى
وفقًا لبيانات كومتريد للأمم المتحدة للواردات العالمية تحت الرمز المنسق 3924.10 في عام 2023، اشترت 135 دولة مستوردة ما يقرب من 11.4 مليار دولار أمريكي إجمالاً. استوردت الولايات المتحدة وحدها 4.58 مليار دولار أمريكي، أو 40.12% من الإجمالي. احتلت ألمانيا المرتبة الثانية بقيمة 581 مليون دولار أمريكي. كانت واردات الولايات المتحدة حوالي 7.9 أضعاف واردات ألمانيا.
| الترتيب | الدولة المستوردة | قيمة الواردات لعام 2023 | الحصة العالمية |
|---|---|---|---|
| 1 | الولايات المتحدة | 4.58 مليار دولار أمريكي | 40.12% |
| 2 | ألمانيا | 581 مليون دولار أمريكي | 5.09% |
| 3 | فرنسا | 433 مليون دولار أمريكي | 3.79% |
| 4 | كندا | 417 مليون دولار أمريكي | 3.65% |
| 5 | المملكة المتحدة | 371 مليون دولار أمريكي | 3.25% |
| 6 | اليابان | 302 مليون دولار أمريكي | 2.64% |
| 7 | إيطاليا | 287 مليون دولار أمريكي | 2.51% |
| 8 | المملكة العربية السعودية | 245 مليون دولار أمريكي | 2.14% |
| 9 | أستراليا | 238 مليون دولار أمريكي | 2.08% |
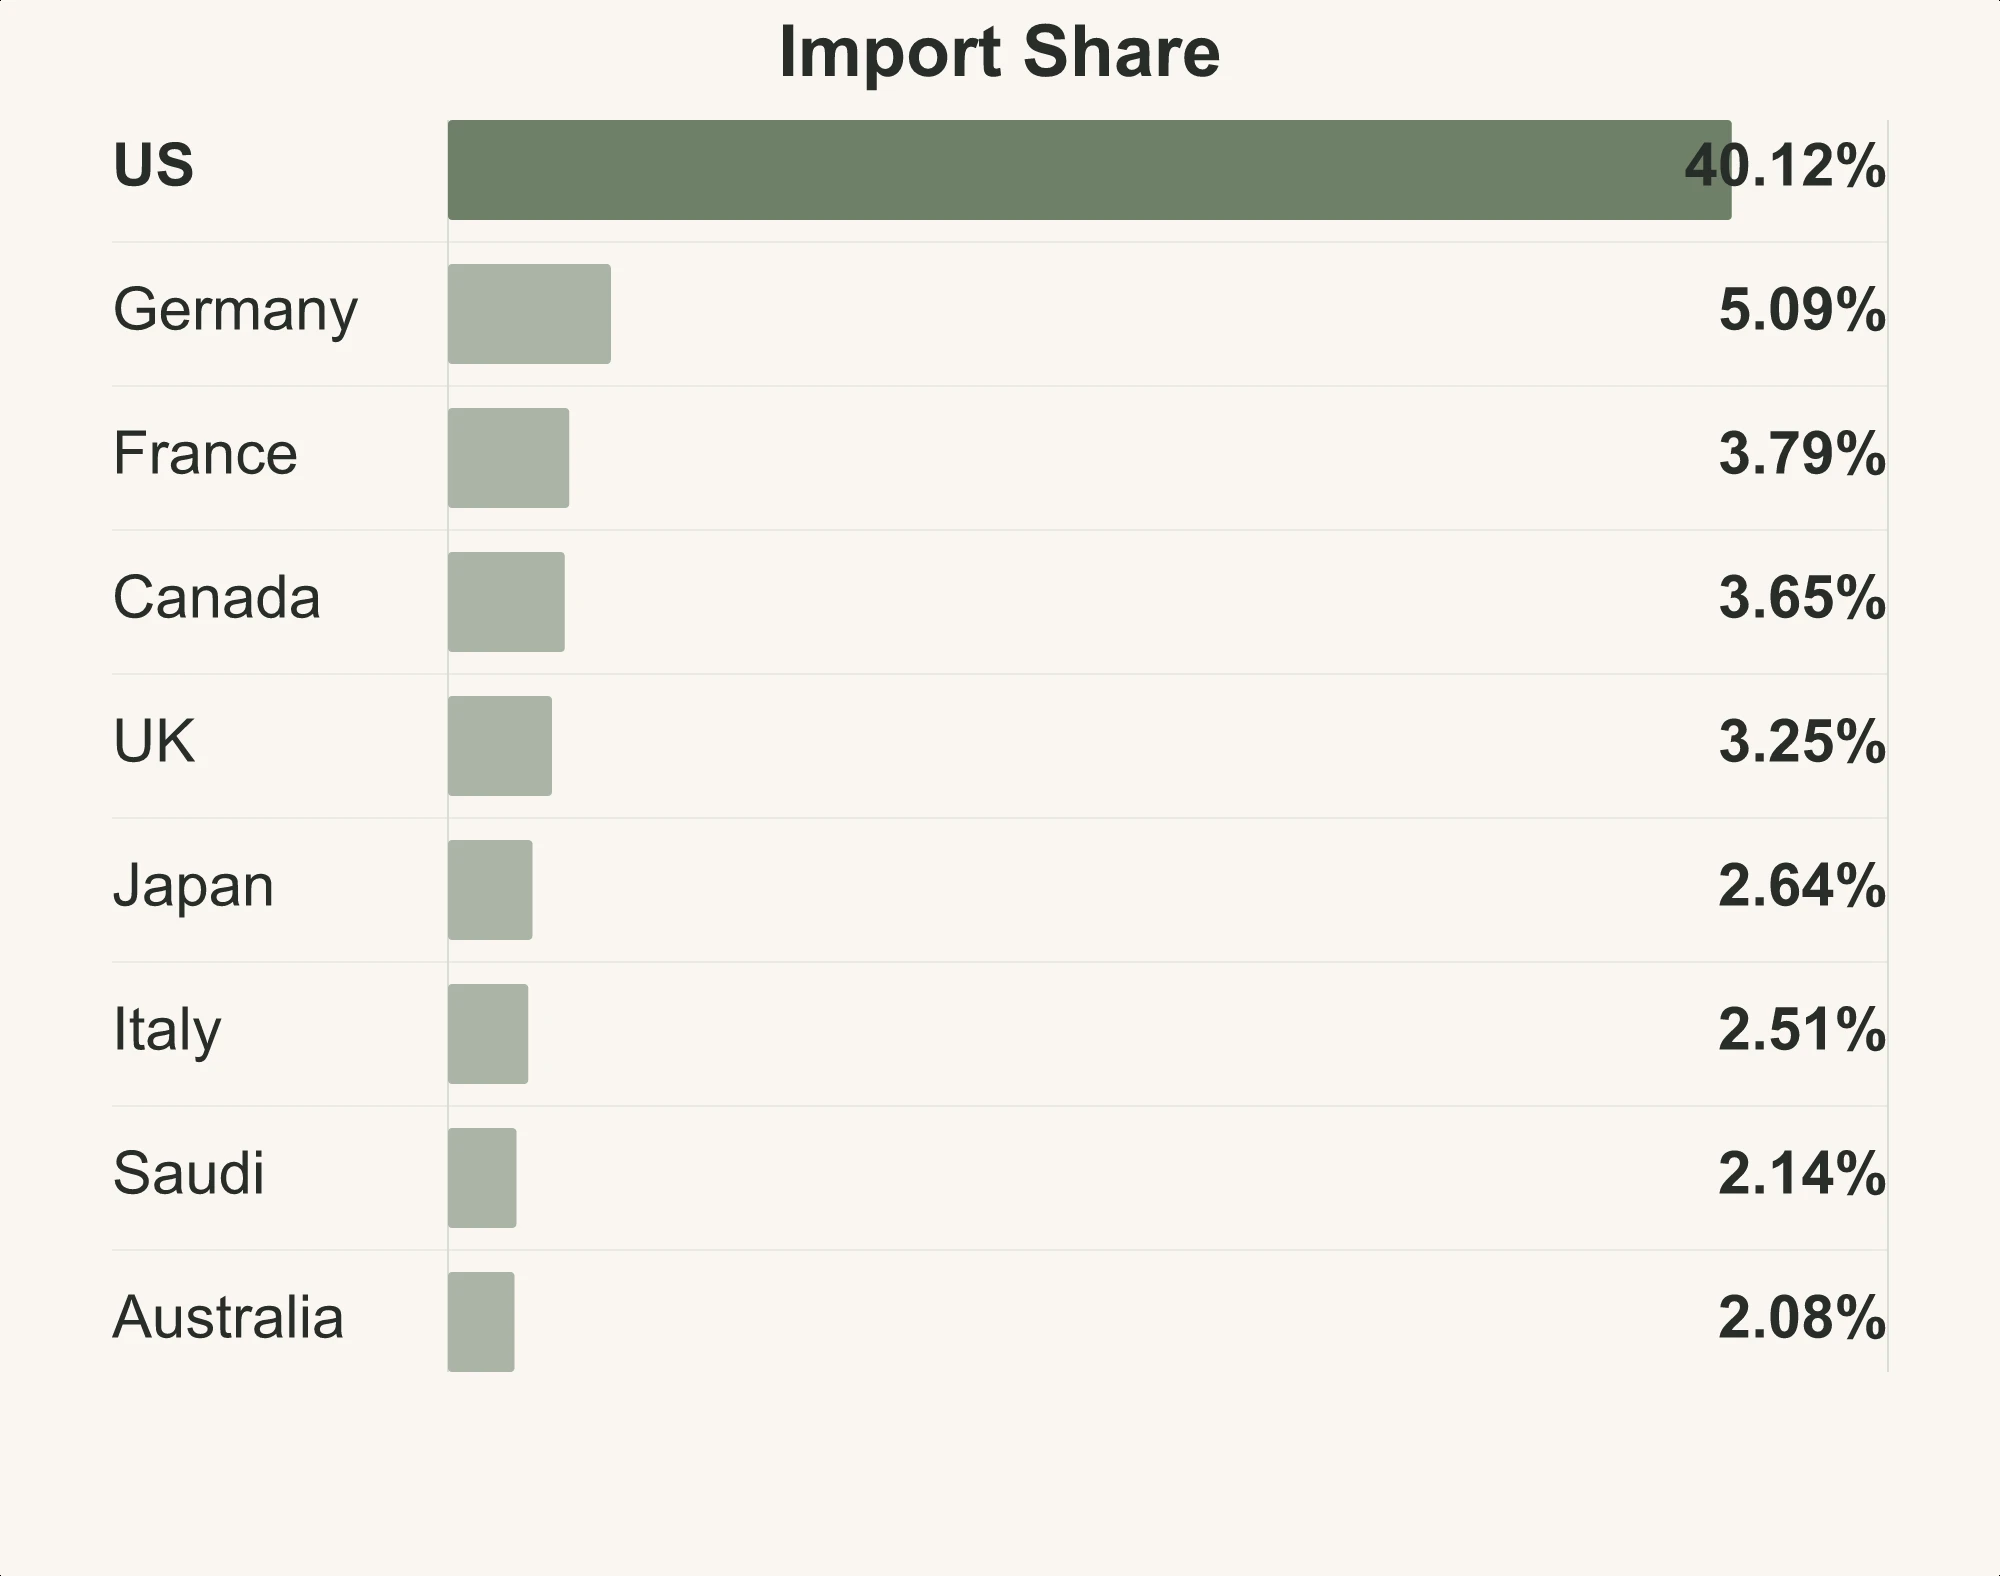
تُظهر قيمة الاستيراد حجم الشراء في كل بلد، ولكن المصانع التي تختار سوقًا ذا أولوية يجب أن تأخذ في الاعتبار أيضًا المنافسة والامتثال. السوق الأمريكي كبير، وقنوات الشراء عبر المنصات والتجزئة والعلامات التجارية الخاصة به ناضجة. كما أن لديه العديد من الموردين المتنافسين والتسعير الشفاف. تستورد ألمانيا وفرنسا أقل بكثير بموجب رمز النظام المنسق 3924.10 مقارنة بالولايات المتحدة، ولكن وثائق الامتثال لملامسة الأغذية غالبًا ما تكون من بين أولى البنود التي يتحقق منها المشترون لديهم. يولي المشترون اليابانيون اهتمامًا أكبر للأبعاد المدمجة والتعبئة الراقية. تشير المعلومات العامة من مهرجان التجارة الجديد في مارس 2025 على Alibaba.com إلى أن بعض المشترين الخليجيين يولون اهتمامًا أكبر للزخرفة ذات اللون الذهبي والتعبئة الجاهزة للهدايا. لذلك، يجب أن يعكس اختيار السوق كلاً من قيمة الاستيراد وما إذا كان المصنع يستطيع تلبية المتطلبات الأولية للمشتري.
إلى أين تتجه المنتجات الصينية الصنع
تعد الصين المورد الرائد في الفئة الأوسع من رمز النظام المنسق 3924 لأدوات المائدة البلاستيكية وأدوات المطبخ والسلع المنزلية. تُظهر بيانات كومتريد التابعة للأمم المتحدة أن الصين صدرت حوالي 9.09 مليار دولار أمريكي بموجب رمز النظام المنسق 3924 في عام 2023، وهو ما يمثل 63.83% من الصادرات العالمية. هذه الأرقام ليست خاصة بأدوات المطبخ المصنوعة من السيليكون، ولكنها توضح ثقل سلسلة التوريد الصينية في المصادر الدولية.
توفر البيانات المبلغ عنها من قبل المستوردين رؤية أكثر تفصيلاً للوجهات. في عام 2023، استوردت الولايات المتحدة حوالي 3.59 مليار دولار أمريكي من منتجات البند الجمركي 3924.10 من الصين. واستوردت اليابان 232 مليون دولار أمريكي، وكندا 216 مليون دولار أمريكي، والمملكة المتحدة 210 مليون دولار أمريكي، وألمانيا 208 مليون دولار أمريكي، وأستراليا 174 مليون دولار أمريكي. لا تعد الولايات المتحدة أكبر سوق استيراد في العالم فحسب، بل هي أيضًا الوجهة التي يتركز فيها التوريد من الصين بشكل أكبر.
تظهر إقرارات الصادرات الصينية أرقامًا مختلفة قليلاً. في العام نفسه، أبلغت الصين عن صادرات بحوالي 3.04 مليار دولار أمريكي إلى الولايات المتحدة، و296 مليون دولار أمريكي إلى المكسيك، و284 مليون دولار أمريكي إلى أستراليا، و279 مليون دولار أمريكي إلى الفلبين، و266 مليون دولار أمريكي إلى ماليزيا. كما تجاوزت الصادرات إلى المملكة المتحدة واليابان والبرازيل والمملكة العربية السعودية أو اقتربت من 200 مليون دولار أمريكي. تختلف التوقيتات والطرق التجارية والأساليب الإحصائية بين إقرارات المصدرين والمستوردين، لذلك لا ينبغي دمج مجموعتي البيانات بندًا ببند. ومع ذلك، فإنهما معًا يظهران أن الولايات المتحدة تتقدم بفارق كبير على أي سوق فردي آخر. اليابان والمملكة المتحدة وألمانيا وكندا وأستراليا هي وجهات راسخة، بينما وصلت الفلبين وماليزيا والبرازيل والمملكة العربية السعودية إلى حوالي 200 مليون دولار أمريكي أو أكثر لكل منها.
إن اعتماد الولايات المتحدة على الإمدادات الصينية ليس جديدًا. تُظهر البيانات التاريخية التي نشرتها IndexBox لعام 2020 أن الولايات المتحدة استوردت 747,000 طن متري من المنتجات المماثلة من الصين، أي ما يعادل 79% من حجم وارداتها. شحنت فيتنام، ثاني أكبر مورد، 45,000 طن متري، وهو أقل من عُشر حجم الصين. هذه الأرقام التاريخية مدرجة كمرجع فقط؛ يستند التصنيف الحالي للسوق في هذه المقالة إلى بيانات الأمم المتحدة لعام 2023 المذكورة أعلاه.
مؤشرات النمو الأوروبي تشير إلى ألمانيا وفرنسا
تعكس البيانات الجمركية حجم السوق، بينما بيانات فعاليات المنصات أكثر ملاءمة لتتبع النشاط قصير الأجل. لا ينبغي دمج الاثنين في تصنيف واحد. أفادت التقارير العامة من مهرجان التجارة الجديد لـ Alibaba.com في مارس 2025 أن حجم الطلبات الأوروبية، وقيمة المعاملات، وعدد المشترين الدافعين ارتفع كل منها بأكثر من 45% على أساس سنوي. تجاوز النمو في فرنسا 125%، بينما ارتفع عدد المشترين الدافعين الجدد عبر المنصة بنسبة 85% على أساس سنوي. تغطي هذه الأرقام جميع الفئات على المنصة، ولا يحدد التقرير العام إلى أي مقياس يشير الرقم 125% الخاص بفرنسا. لذلك، تُستخدم هذه الأرقام كمؤشر للنشاط قصير الأجل فقط، وليس كمعدل نمو مخصص لأدوات المطبخ المصنوعة من السيليكون.
يوفر حجم الاستيراد سياقًا مفيدًا: احتلت فرنسا المرتبة الثالثة عالميًا كأكبر مستورد ضمن رمز النظام المنسق 3924.10 في عام 2023، بينما جاءت ألمانيا في المرتبة الثانية. يجب على الموردين القادرين على إعداد وثائق الامتثال الأوروبية وسجلات تتبع التعبئة والتغليف أن يعتبروا ألمانيا وفرنسا أسواقًا للتطوير على المدى الطويل، بدلاً من التعامل مع أوروبا كمجرد بديل للولايات المتحدة.
تُظهر كندا والمملكة المتحدة وأستراليا أيضًا قيم استيراد مستقرة. ومع ذلك، تؤكد الأدلة المتاحة حجم أسواقها فقط؛ وهي ليست كافية لتحديد تفضيلات تخصيص أدوات المطبخ المصنوعة من السيليكون التي تختلف عن تلك الموجودة في الولايات المتحدة أو أوروبا القارية.
ما الذي يسأل عنه المشترون الأمريكيون أولاً
يشمل المشترون النموذجيون للمنتجات المخصصة في السوق الأمريكية بائعي العلامات التجارية الخاصة على أمازون والعلامات التجارية التي تبيع مباشرة للمستهلك (DTC). غالبًا ما يناقش هؤلاء المشترون المنتج وبرنامج البيع بالتجزئة معًا. يجب أن تتطابق ألوان السيليكون مع مراجع بانتون، بينما يجب تسعير عدد القطع، والتعبئة والتغليف ذات العلامة التجارية، ومواصفات الكرتون لخدمة الشحن من أمازون (FBA) في نفس الوقت. لا يسمح سعر الوحدة وحده للمشتري بتقدير التكلفة النهائية الواصلة.
يساعد الفارق بين أسعار المصنع وأسعار التجزئة في تفسير نموذج الشراء هذا. أشار تقرير عام صادر عن منصة Accio، وهي منصة الذكاء الاصطناعي للمصادر من Alibaba، إلى مجموعات أدوات مطبخ سيليكون مكونة من 11 قطعة من عدة مصانع في مجمع يانغجيانغ الصناعي بأسعار تتراوح تقريبًا بين 3.85 دولار أمريكي و 7.90 دولار أمريكي، مع كميات طلب دنيا معروضة تتراوح من 100 إلى 1000 مجموعة. ووضع التقرير نفسه أسعار التجزئة الشائعة في أمازون بالولايات المتحدة للمجموعات المماثلة عند حوالي 15 دولارًا أمريكيًا إلى 35 دولارًا أمريكيًا. هذه الأرقام هي لقطة من القوائم العامة اعتبارًا من أغسطس 2026. وهي تمثل الأسعار وكميات الطلب المدرجة لبعض الموردين فقط في ذلك الوقت، وليست شروط YueHouDZ الثابتة أو معيارًا صناعيًا عامًا. يترك الفارق في الأسعار للعلامات التجارية مجالًا للإنفاق على المنتجات والتسويق، وهو أحد الأسباب التي قد تدفع المشترين إلى التفكير في الألوان المخصصة والتعبئة وتكوينات المجموعات.
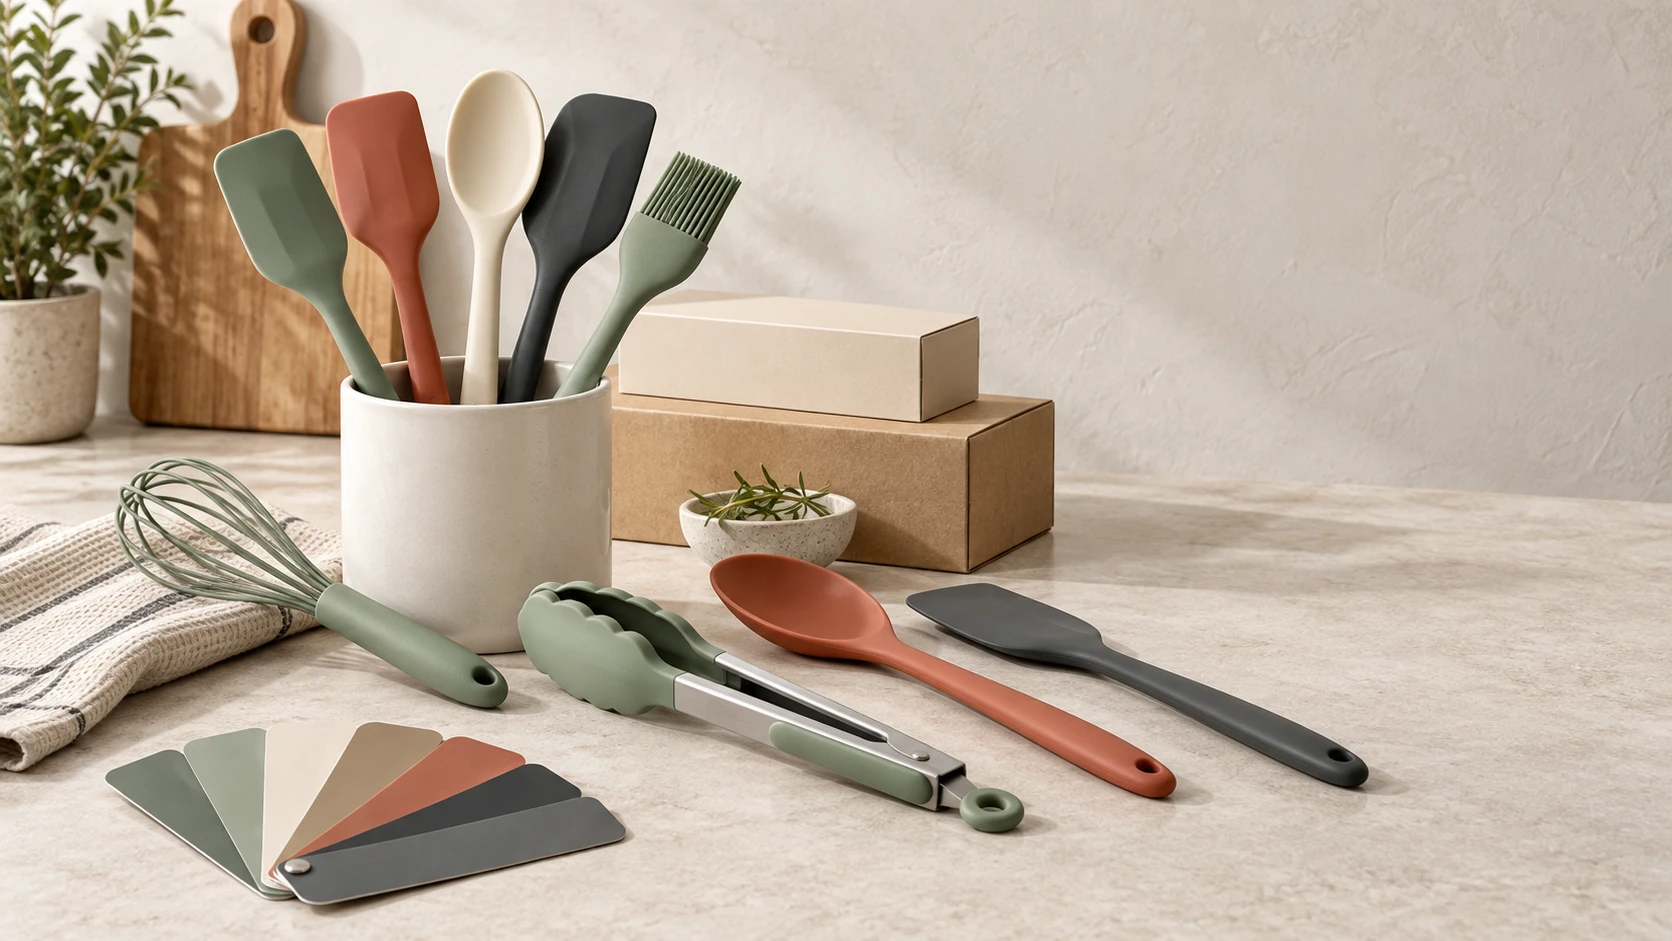
اختيار الألوان ليس عشوائيًا أيضًا. في الولايات المتحدة، تظهر عينات التجزئة من أمازون التي جمعتها Accio، ألوانًا هادئة مثل الأخضر المريمي والكريمي جنبًا إلى جنب مع أدوات السيليكون ذات المقابض الخشبية أو المصنوعة من الخيزران. عند التعامل مع هذا النوع من الاستفسارات، يجب على المصانع تأكيد مرجع اللون ومادة المقبض والاتساق البصري عبر المجموعة الكاملة مسبقًا.
يطلب المشترون الأمريكيون عادةً وثائق الامتثال لإدارة الغذاء والدواء (FDA). وقد تواجه المنتجات المباعة عبر القنوات التجارية أيضًا متطلبات القنوات المتعلقة بمعايير NSF. أثناء عملية التوريد، تتمثل الخطوة الأولى في تأكيد اسم التقرير والمواد التي يغطيها؛ وتندرج بنود الاختبار المحددة ضمن مراجعة امتثال منفصلة. في مناقشة أولية مع مشترٍ أمريكي، يمكن للموردين تأكيد وثائق الامتثال، وتحديد التكوين، والتعبئة والتغليف للبيع بالتجزئة، والمواصفات الجاهزة للمستودع معًا قبل مناقشة التسعير المتدرج. وهذا يمنح المشتري أساسًا أكثر اكتمالاً للتقييم من قائمة الأسعار وحدها.
المشترون الألمان عادة ما يطلبون وثائق LFGB أولاً
يميل المشترون الألمان أكثر إلى البدء بوثائق الامتثال. الإطار الأوروبي المشترك للمواد الملامسة للأغذية هو اللائحة (EC) رقم 1935/2004، بينما LFGB هو قانون ألماني؛ ولا ينبغي وصفه بأنه متطلب LFGB موحد وإلزامي في جميع أنحاء الاتحاد الأوروبي. ومع ذلك، تطبق ألمانيا ضوابط صارمة، وغالبًا ما يستخدم المشترون في أماكن أخرى من أوروبا القارية تقارير LFGB كمرجع مهم لسيليكون بدرجة الغذاء.
وثائق إدارة الغذاء والدواء الأمريكية (FDA) ووثائق LFGB الألمانية ليست نفس التقرير بأسماء مختلفة. في برامج الاختبار الشائعة، تركز متطلبات إدارة الغذاء والدواء للمواد المطاطية القابلة لإعادة الاستخدام المخصصة للتلامس مع الأغذية بشكل أساسي على المستخلصات في الماء والهكسان العادي (n-hexane)، مما يشير إلى ما قد يهاجر من المادة في الظروف المائية والدهنية. تتضمن برامج اختبار LFGB للسيليكون عادةً حوالي سبعة إلى ثمانية بنود، مع المزيد من الفحوصات المتعلقة بالبقايا والرائحة. غالبًا ما يكون تقرير إدارة الغذاء والدواء وحده غير كافٍ للاستفسارات الألمانية. قد يسأل المشترون الفرنسيون أيضًا عن متطلبات الإنفاذ المحلية من المديرية العامة للمنافسة وشؤون المستهلك ومكافحة الاحتيال (DGCCRF). يجب تأكيد طرق الاختبار والرسوم والمواعيد النهائية في مراجعة امتثال منفصلة.
| السوق | ما يحرص المشترون على تأكيده مبكرًا | أولويات مناقشة التخصيص |
|---|---|---|
| الولايات المتحدة | وثائق إدارة الغذاء والدواء (FDA)؛ كما تسأل بعض القنوات التجارية عن NSF | مطابقة ألوان بانتون (Pantone)، وتكوين المجموعة، والتعبئة ذات العلامة التجارية، والمواصفات الجاهزة للمستودع |
| ألمانيا | تقرير LFGB والامتثال لإطار الاتحاد الأوروبي | ما إذا كان التقرير يغطي المادة وما إذا كانت سجلات التعبئة والتغليف والتتبع كاملة |
| فرنسا | إطار الاتحاد الأوروبي ومتطلبات المديرية العامة الفرنسية للمنافسة وشؤون المستهلك ومكافحة الاحتيال (DGCCRF) | متطلبات الإنفاذ المحلية بالإضافة إلى الامتثال الأوروبي العام |
| اليابان | دعم إخطار الاستيراد بموجب قانون سلامة الغذاء | الأبعاد المدمجة، جودة التعبئة والتغليف، ووثائق الاستيراد |
| مشترو المنصات في المملكة العربية السعودية والخليج | متطلبات دخول السوق المحلي والقنوات | الديكورات باللون الذهبي والتصاميم الموجهة للهدايا، يتم تأكيدها استفسارًا باستفسار |
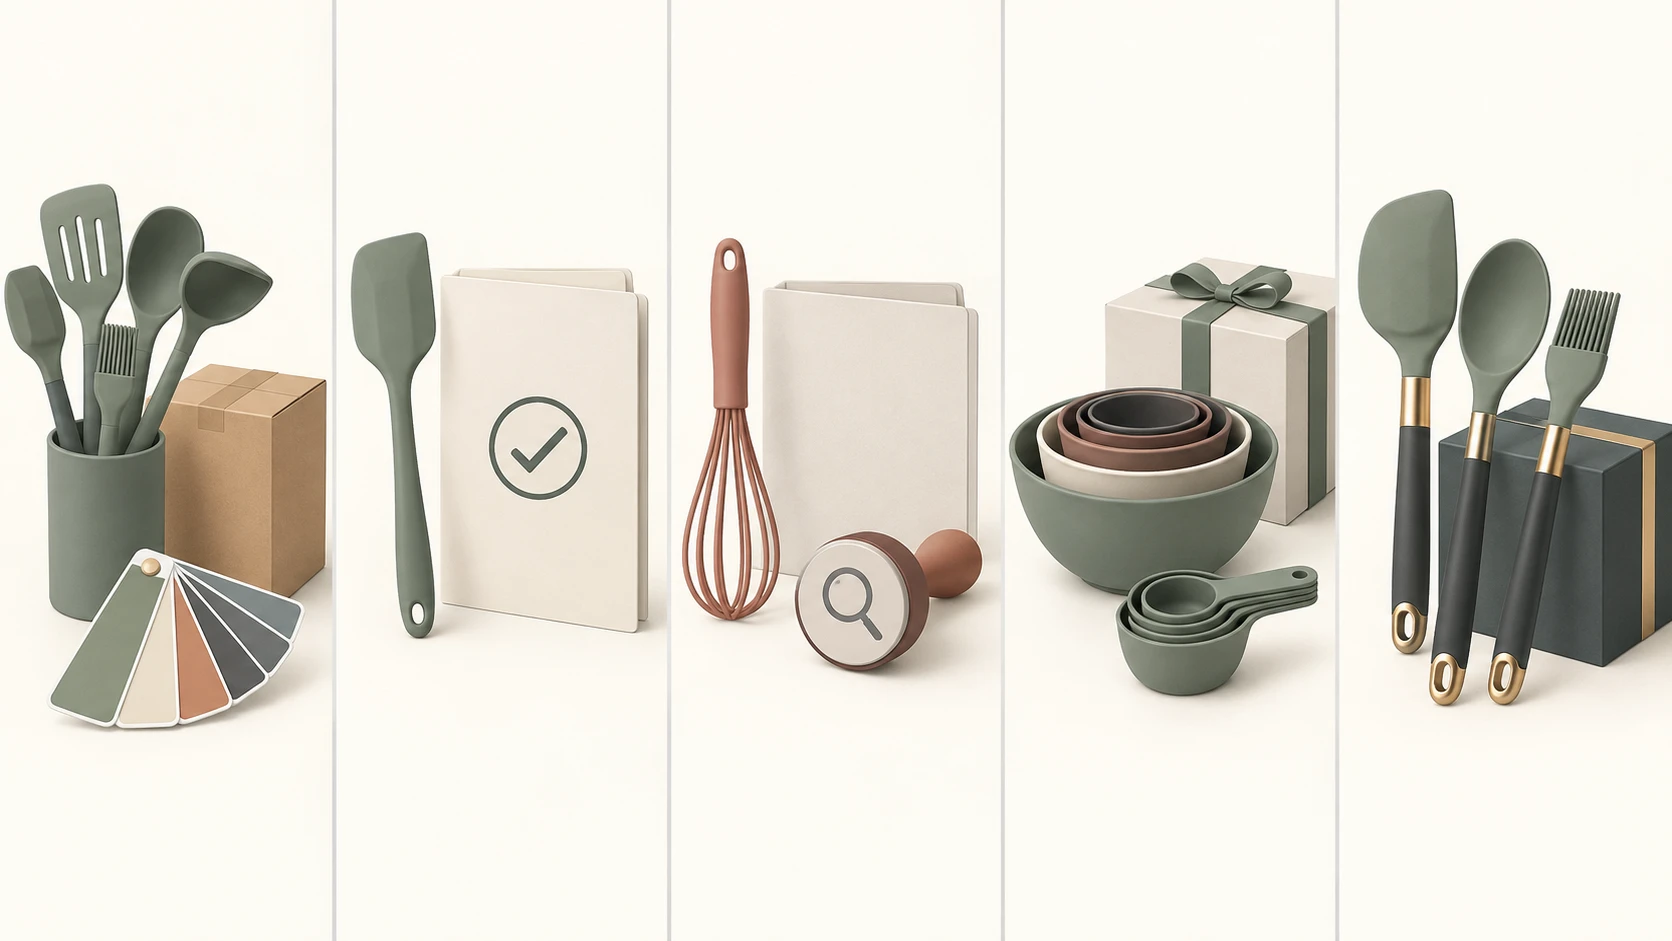
يمكن لفرق المبيعات استخدام هذا الجدول لتحديد الأولويات في ردهم الأول على الاستفسار. يرغب المشترون الألمان في التحقق من التقارير أولاً، وغالبًا ما يقيم المشترون الأمريكيون برنامج البيع بالتجزئة في نفس الوقت، ويحتاج المستوردون اليابانيون إلى وضوح مبكر بشأن دعم إخطار الاستيراد. يمكن أن يحدد ترتيب التواصل ما إذا كان الاستفسار سيتقدم أم لا.
اليابان: أحجام أصغر، متطلبات أكثر تفصيلاً
استوردت اليابان ما يقرب من 302 مليون دولار أمريكي ضمن رمز النظام المنسق 3924.10 في عام 2023، بما في ذلك حوالي 232 مليون دولار أمريكي من الصين. سوق استيرادها أصغر بكثير من سوق الولايات المتحدة، ولكن ضمن الفئة الثانية، تظل قيمة مشترياتها من الصين كبيرة.
تشير معلومات سوق أدوات المطبخ اليابانية من فورشن بيزنس إنسايتس إلى اهتمام أقوى بالمنتجات المدمجة والموفرة للمساحة؛ والتصميم الأنيق؛ وتغليف الهدايا. هذا لا يعني أن كل عميل ياباني لديه نفس التفضيلات. ومع ذلك، فإن إجراءات الاستيراد في اليابان واضحة: تتطلب المادة 27 من قانون سلامة الغذاء من مستوردي الأغذية والأجهزة والحاويات والتعبئة والتغليف تقديم إشعار استيراد إلى محطة الحجر الصحي التابعة لوزارة الصحة والعمل والرعاية الاجتماعية. لا يمكن استبدال هذا الإجراء القانوني بما يسمى وثيقة "شهادة يابانية" واحدة.
لذلك، يجب ألا تكتفي برامج التخصيص لليابان بنسخ نهج المجموعات الكبيرة المستخدم في الولايات المتحدة. قم أولاً بتأكيد الأبعاد وطريقة التخزين وعدد القطع في المجموعة وجودة التعبئة والتغليف، ثم نسّق وثائق إشعار الاستيراد مع المستورد الياباني. قد تكون أحجام الطلبات أقل مما هي عليه في الولايات المتحدة، لكن المشروع لا يزال يتطلب معلومات كاملة منذ البداية.
الشرق الأوسط وأمريكا اللاتينية: نمو المنصات السريع
يظهر الشرق الأوسط بالفعل في تصنيف قيمة الواردات: استوردت المملكة العربية السعودية ما يقرب من 245 مليون دولار أمريكي تحت بند النظام المنسق HS 3924.10 في عام 2023. كما أفادت المعلومات العامة من Alibaba.com عن نمو في الطلبات بأكثر من 40% في المملكة العربية السعودية ووضعت الإمارات العربية المتحدة ضمن أكبر خمسة أسواق من حيث حجم الطلبات خلال تلك النسخة من مهرجان التجارة الجديد. وذكر المصدر نفسه طلب المشترين في الشرق الأوسط على الأنماط المطلية بالذهب والأكثر فخامة. نظرًا لعدم توفيره فترة المقارنة لنمو السعودية أو نطاق العينة وراء ملاحظاته حول الأنماط، فإن هذه الأرقام مناسبة فقط كمؤشرات لاختيار المنتجات. لا تزال المتطلبات الفعلية بحاجة إلى تأكيد مع كل استفسار، ويجب عدم تعميم البيانات على سوق الشرق الأوسط بأكمله.
لهذه الاستفسارات، اسأل أولاً عن النمط الذي يرغب به المشتري: هل هو ديكور بلون ذهبي، أم تغليف هدايا، أم مجموعة قياسية بكميات كبيرة؟ يجب تأكيد أي منطقة زخرفية مطلية وفصلها عن الأسطح الملامسة للطعام بشكل منفصل أثناء مراجعة المواصفات.
تأتي المؤشرات الحديثة من أمريكا اللاتينية بشكل رئيسي أيضًا من بيانات المنصات. وذكر المصدر نفسه من Alibaba.com أن الطلبات في الأرجنتين نمت بنسبة 101% على أساس سنوي، بينما ارتفع الرقم الخاص بتشيلي بأكثر من 70%. لم يذكر المصدر ما إذا كان الرقم الخاص بتشيلي يشير إلى حجم الطلبات أو قيمة المعاملات أو عدد المشترين، كما لم يقدم الفترات الإحصائية الدقيقة للرقمين. النمو السريع خلال حدث على منصة لا يعادل إجمالي حجم واردات الدولة ولا يمكنه التنبؤ بالحجم المتاح لأي مصنع فردي. يمكن للفرق التي لم تطور هذه الأسواق بعد أن تبدأ بحملات صغيرة، وتقييم جودة الاستفسارات الفعلية، ثم تقرر ما إذا كانت ستزيد الإنفاق. هذا أكثر موثوقية من استبدال معدلات نمو المنصات بقيم الواردات الجمركية.
النقاط الرئيسية
لا تزال بيانات الاستيراد والتصدير الخاصة برمز النظام المنسق 3924.10 تشير إلى الولايات المتحدة كسوق ذي أولوية قصوى. إنها الأكبر من حيث القيمة، وتتجاوز وارداتها من الصين بكثير واردات أي سوق آخر. كما أن لديها هيكل أسعار ناضجًا لتخصيص المنتجات ذات العلامة التجارية الخاصة. تمثل ألمانيا وفرنسا فرصة مختلفة: فقيمهما المطلقة أقل من قيم الولايات المتحدة، لكن مهرجان التجارة الجديد في مارس 2025 على Alibaba.com أبلغ عن نمو سنوي قوي في أوروبا. ومن المرجح أن ينظر المشترون المتطلبون في الموردين الذين لديهم وثائق امتثال وتتبع كاملة. تناسب اليابان الموردين الذين يمكنهم التعامل مع التصاميم المدمجة، والتعبئة والتغليف المتقن، ودعم إشعارات الاستيراد. يستحق الشرق الأوسط وأمريكا اللاتينية المتابعة، ولكن في الوقت الحالي، يجب التعامل مع نمو المنصة كإشارة بدلاً من توقعات مبيعات.
تخصصت YueHouDZ في منتجات السيليكون المخصصة منذ عام 2015، وقد أنتجت عناصر ملامسة للأغذية مثل حصائر الخبز المصنوعة من السيليكون ومناخل الخبز. يمكن لـ YueHouDZ المساعدة في تقارير الامتثال التي يحتفظ بها موردو المواد الخام لديها. لتقييم ما إذا كان منتج أدوات المطبخ المصنوع من السيليكون أنسب للولايات المتحدة أو ألمانيا أو اليابان أو أي سوق آخر، يرجى تضمين البلد المستهدف، وتكوين المجموعة، ومتطلبات التعبئة والتغليف، والكمية المقدرة في استفسارك. توفر هذه المعلومات أساسًا أقوى بكثير لعرض أسعار ذي صلة من مجرد طلب سعر الوحدة.